


Week 6
Microclimates and Data Science
How hot is our school? How can we measure temperatures in different locations?
This week you will complete Task 2 and conduct a microclimate investigation using the data collected over the summer break and with your thermal camera. You will interpret the microclimate data sets, analyse and visualise the data, and make recommendations for changes to the hottest locations in the school. You can share this task at the 50°C Climate Summit on 11 April 2025.
‘A microclimate in our city could be the climate in a park, compared to the climate in an industrial area because of the different materials and difference in the vegetation, the difference in open space and how this space is ventilated. You will find that temperatures and relative humidity will vary. One of the most important things we find consistently is we are under-reporting how hot it really is where people live and work and play and spend their time. And that is because the info we get from Bureau of Meteorology is not made for microclimate assessment.’
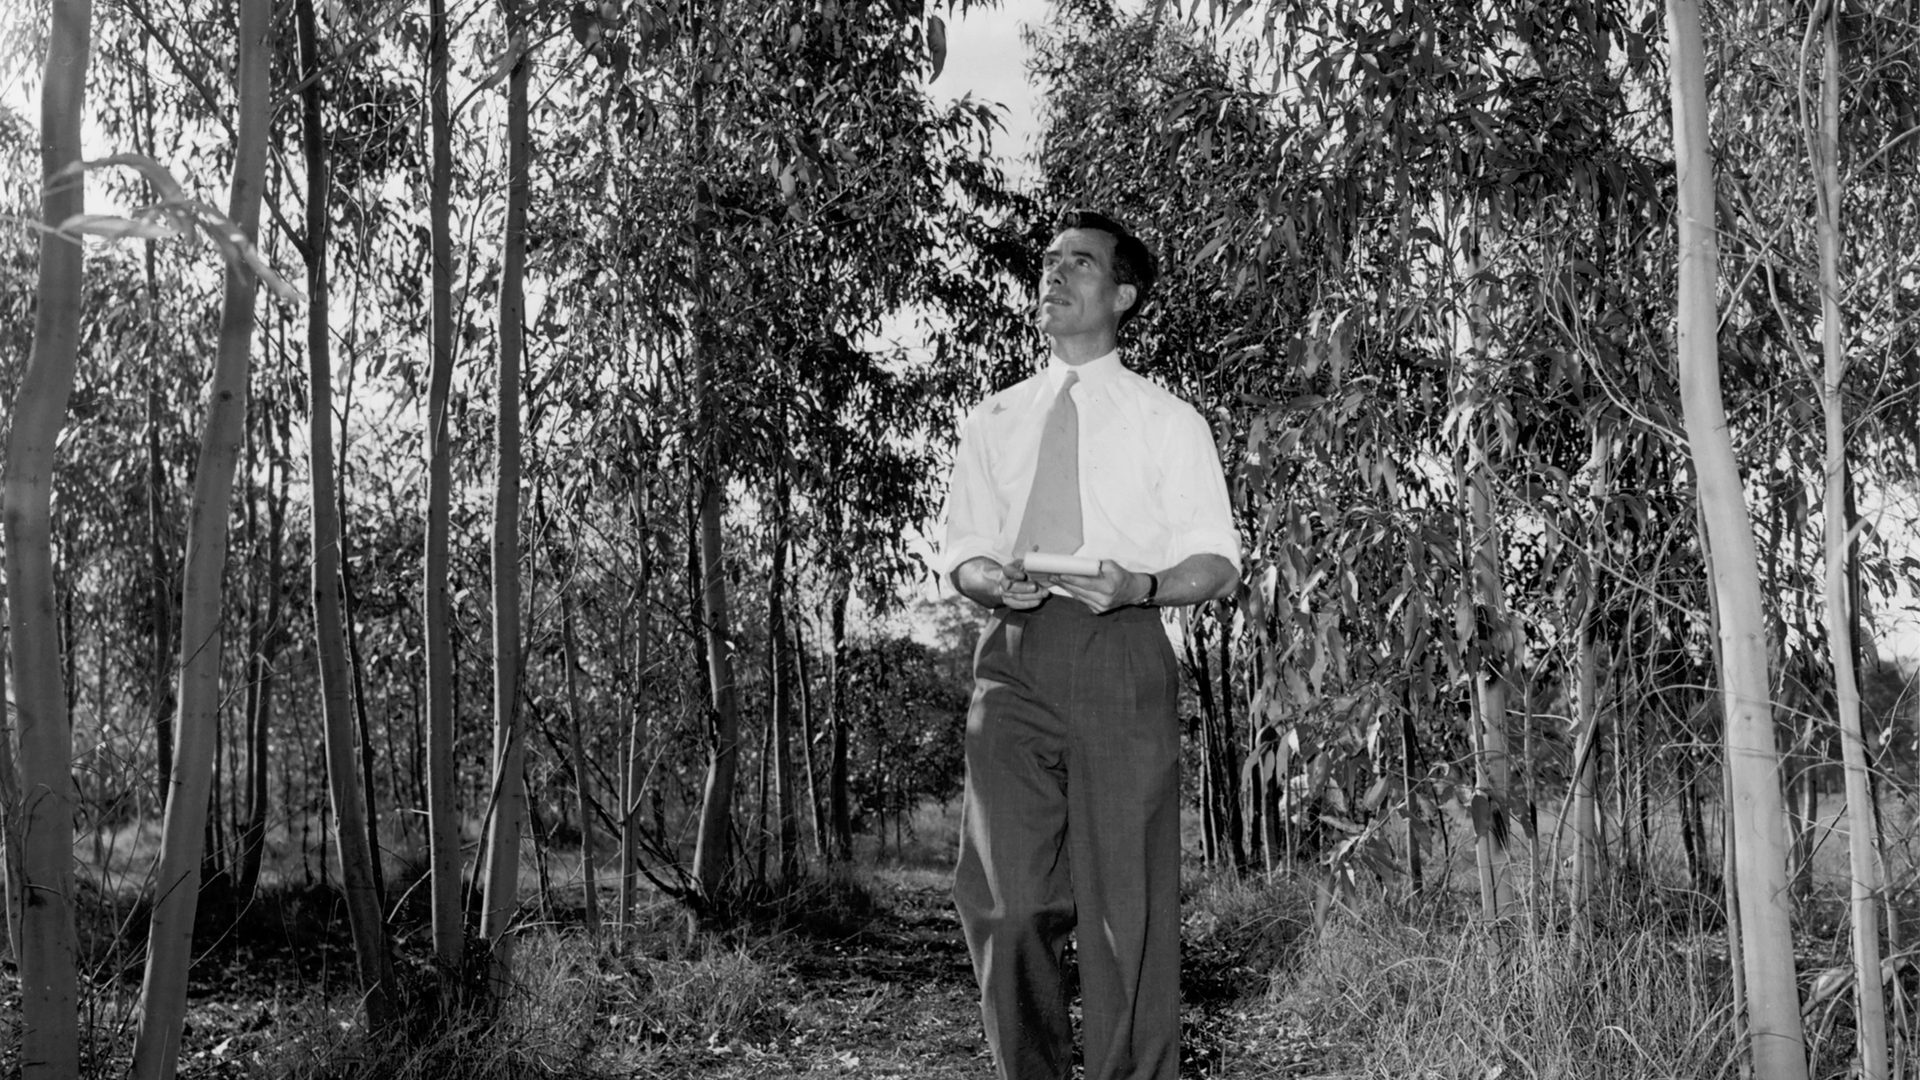
Microclimates with Dr Sebastian Pfautsch
Dr Sebastian Pfautsch introduces the importance of investigating local microclimates and implementing urban cooling strategies such as green and blue infrastructure to mitigate heat in microclimates.