Stories

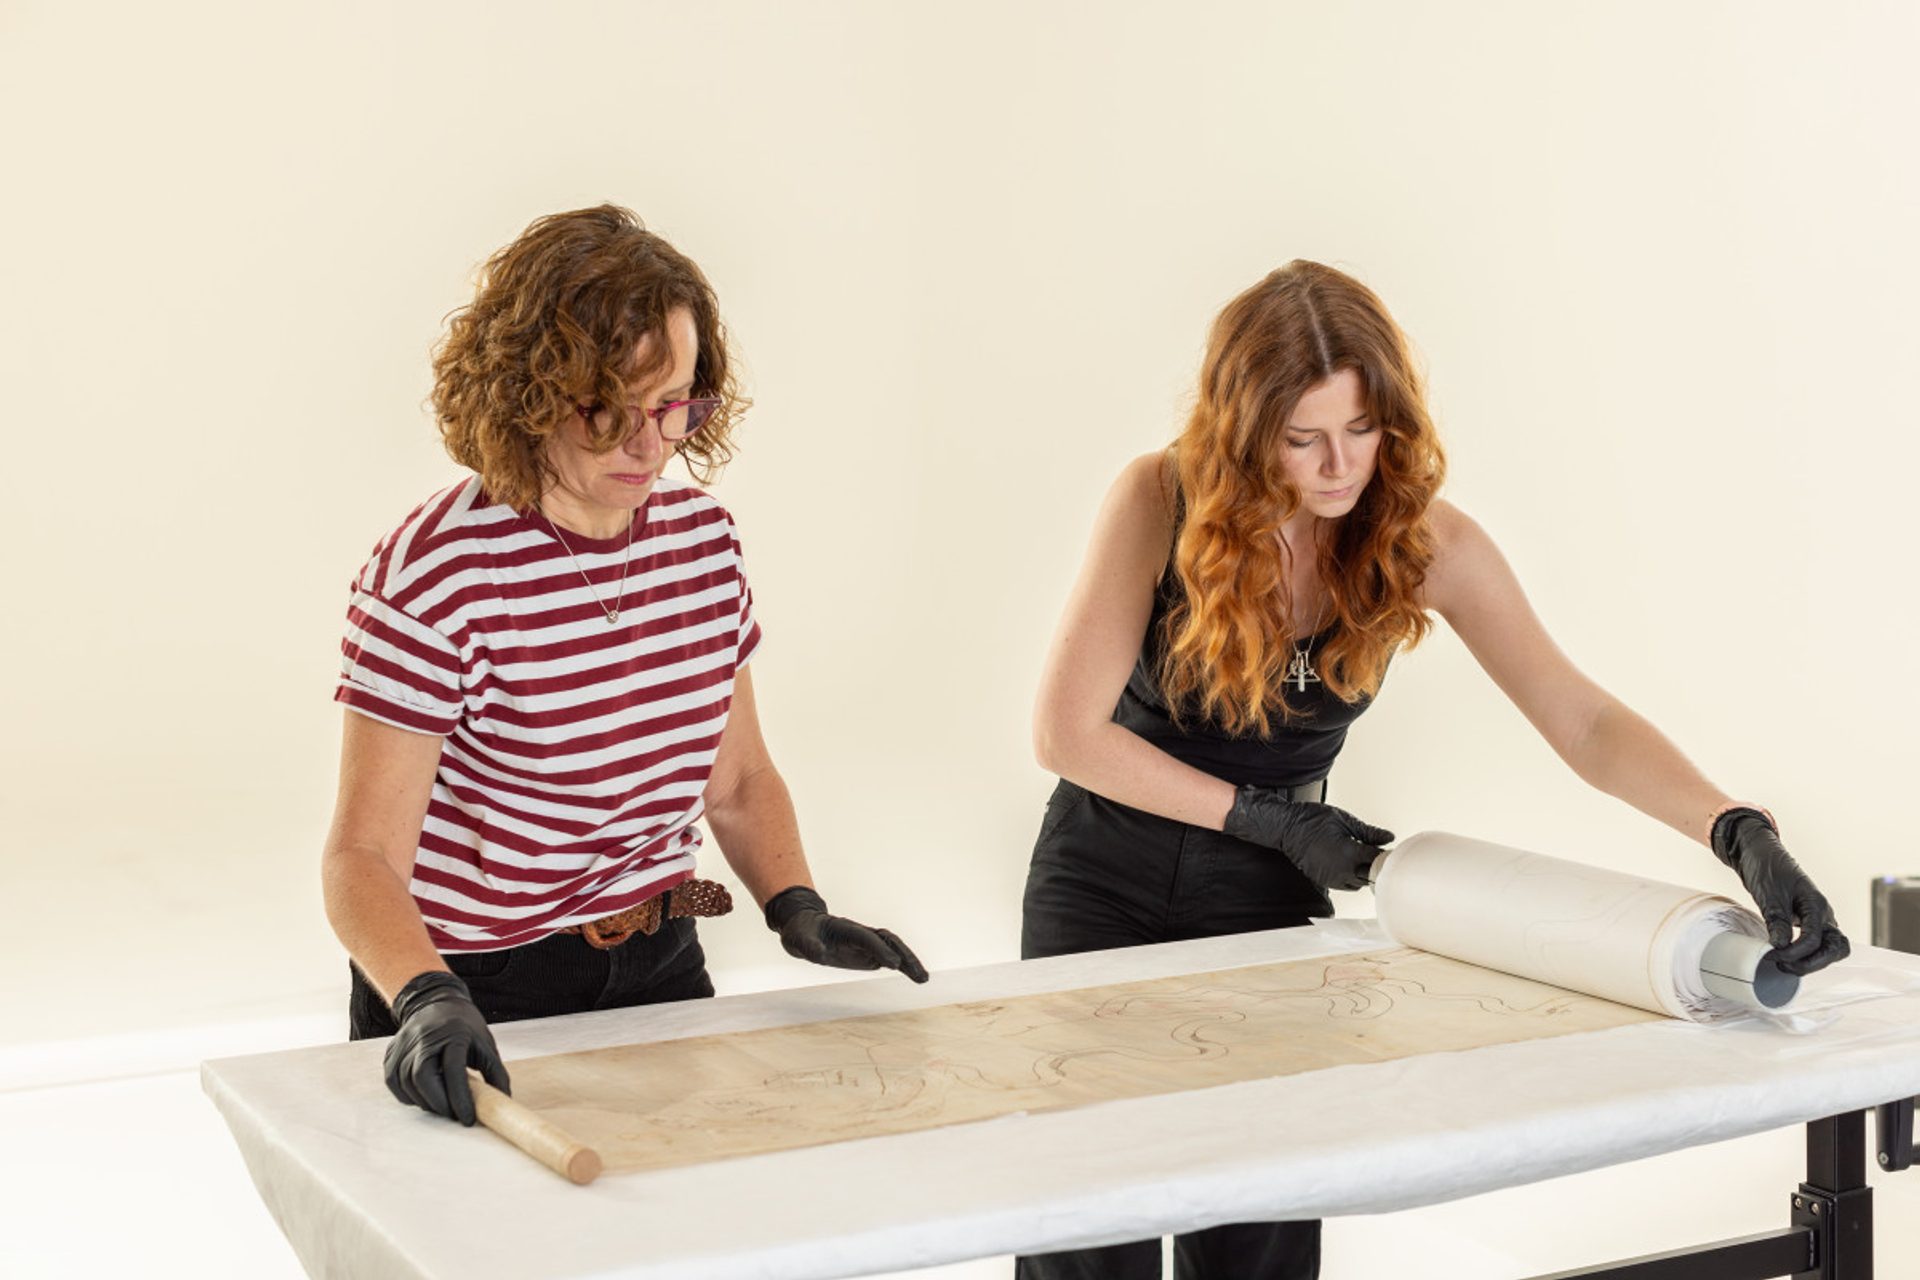
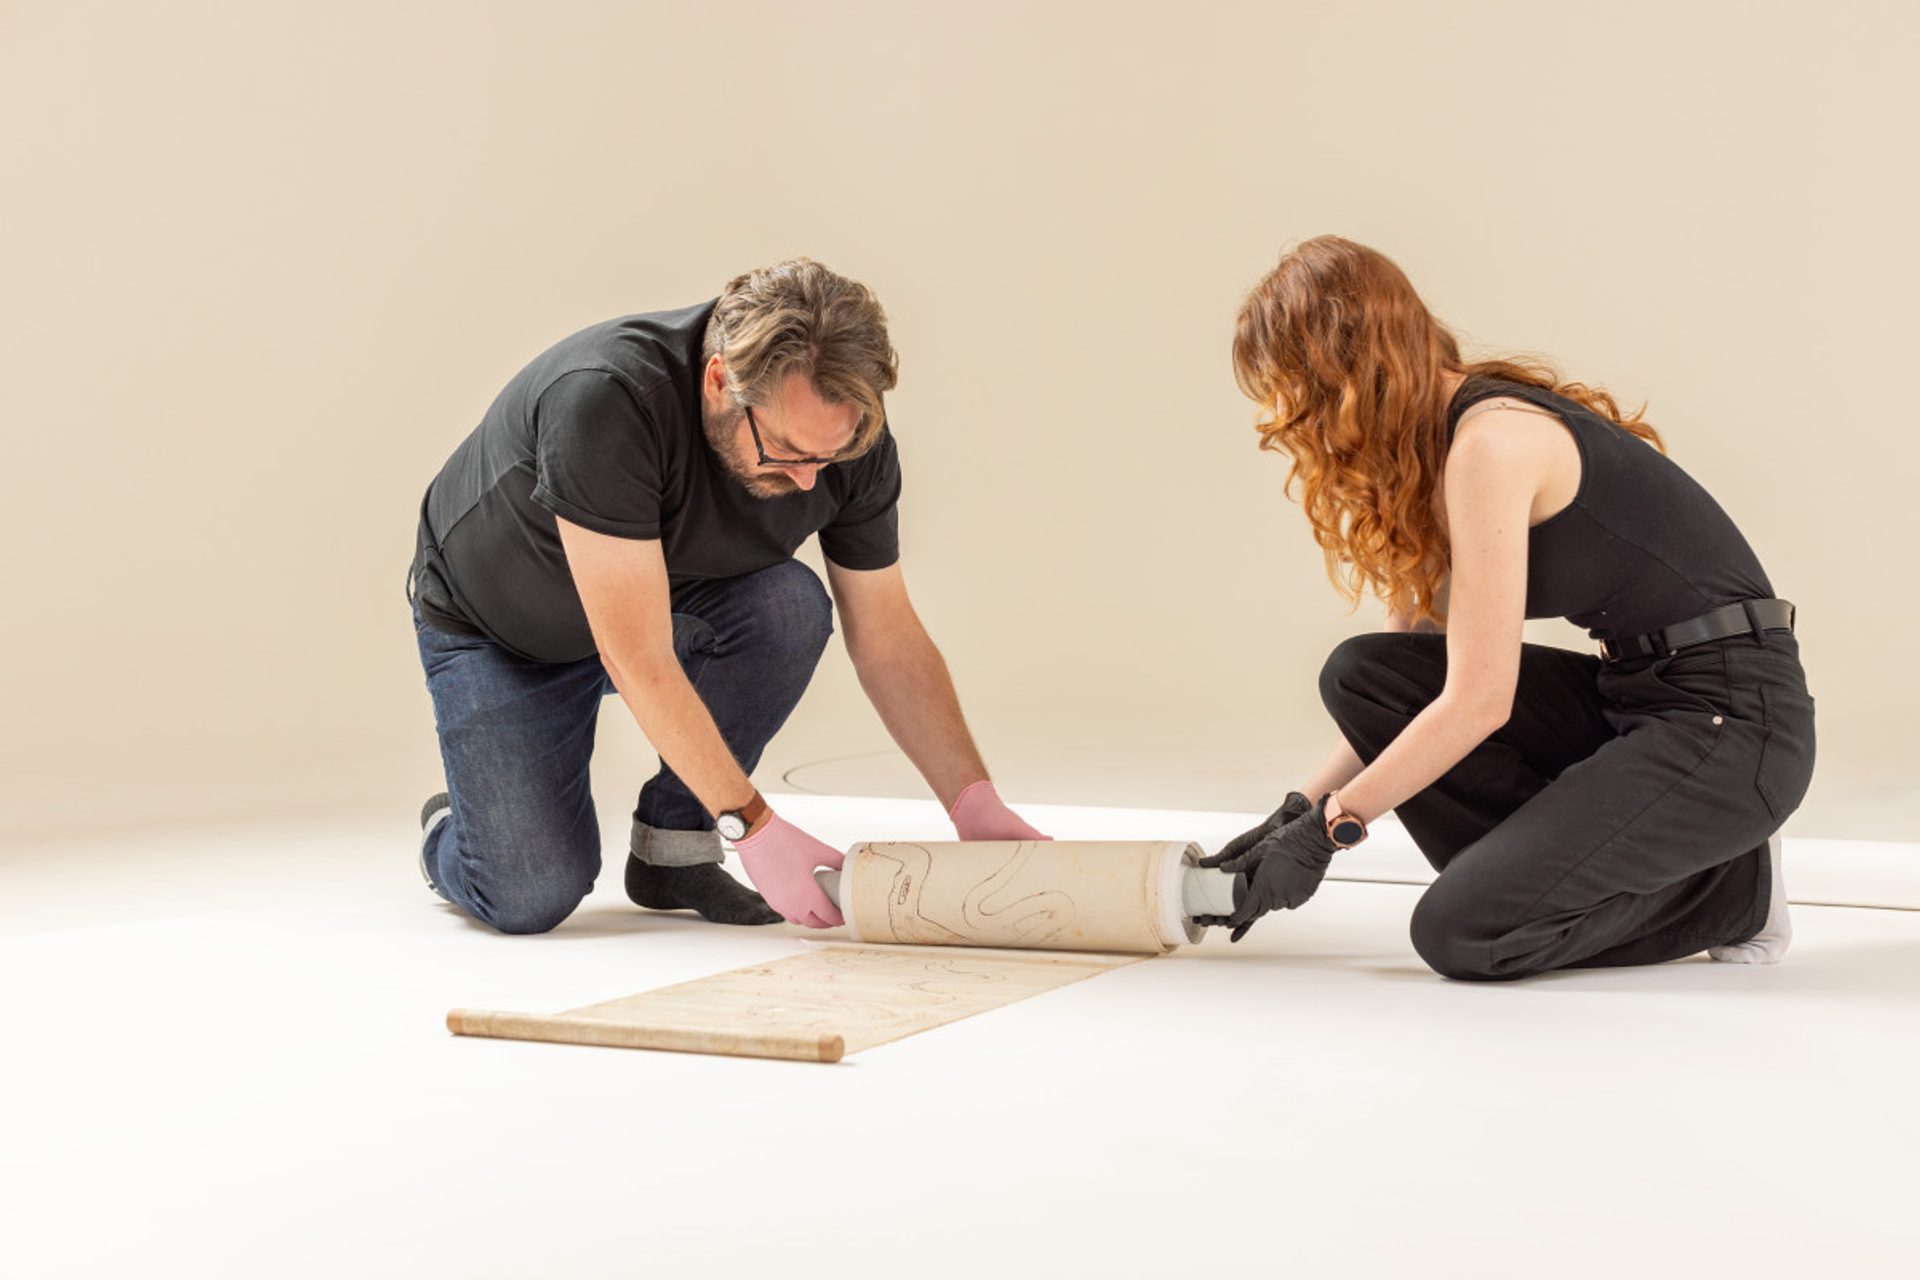
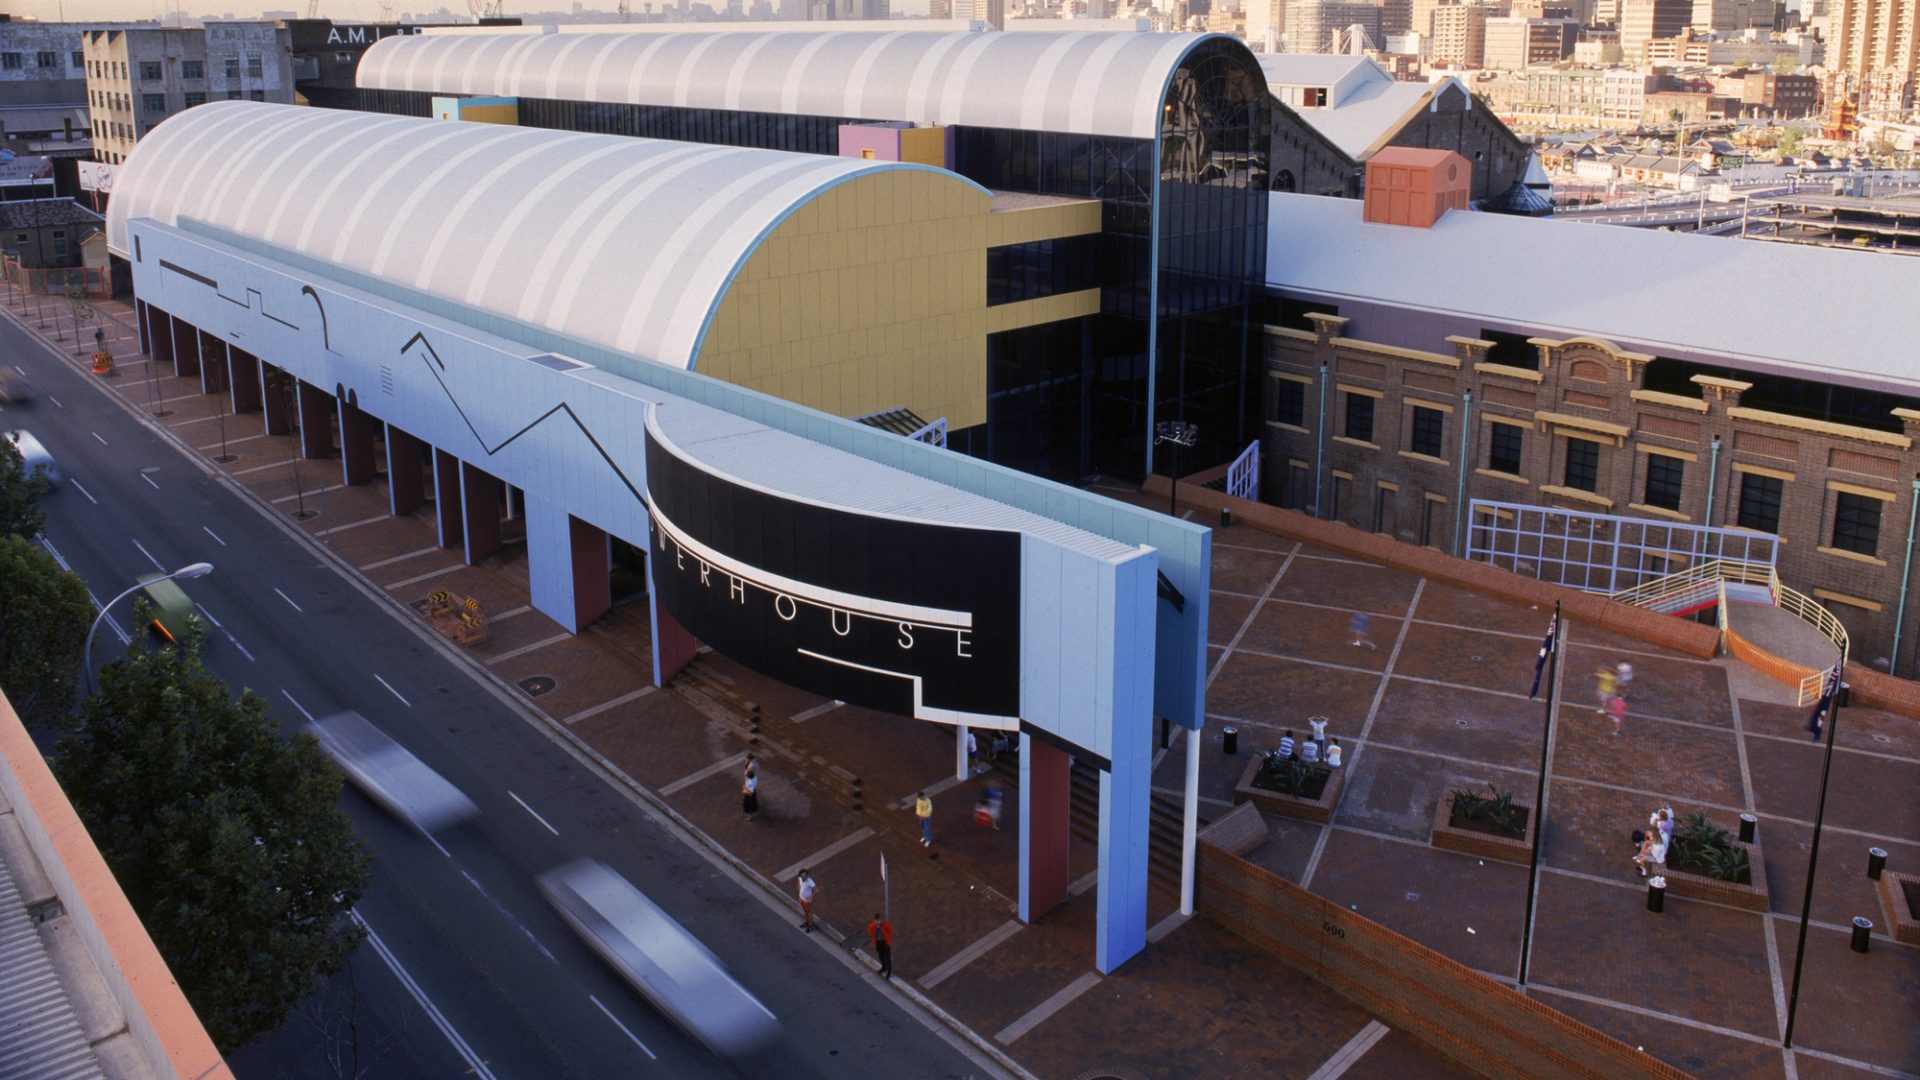
Digitising and conserving Powerhouse Object 86/1251

39-metre navigational chart of the Barka / Darling River
Interviews by Stuart Ridley
Story Header Image

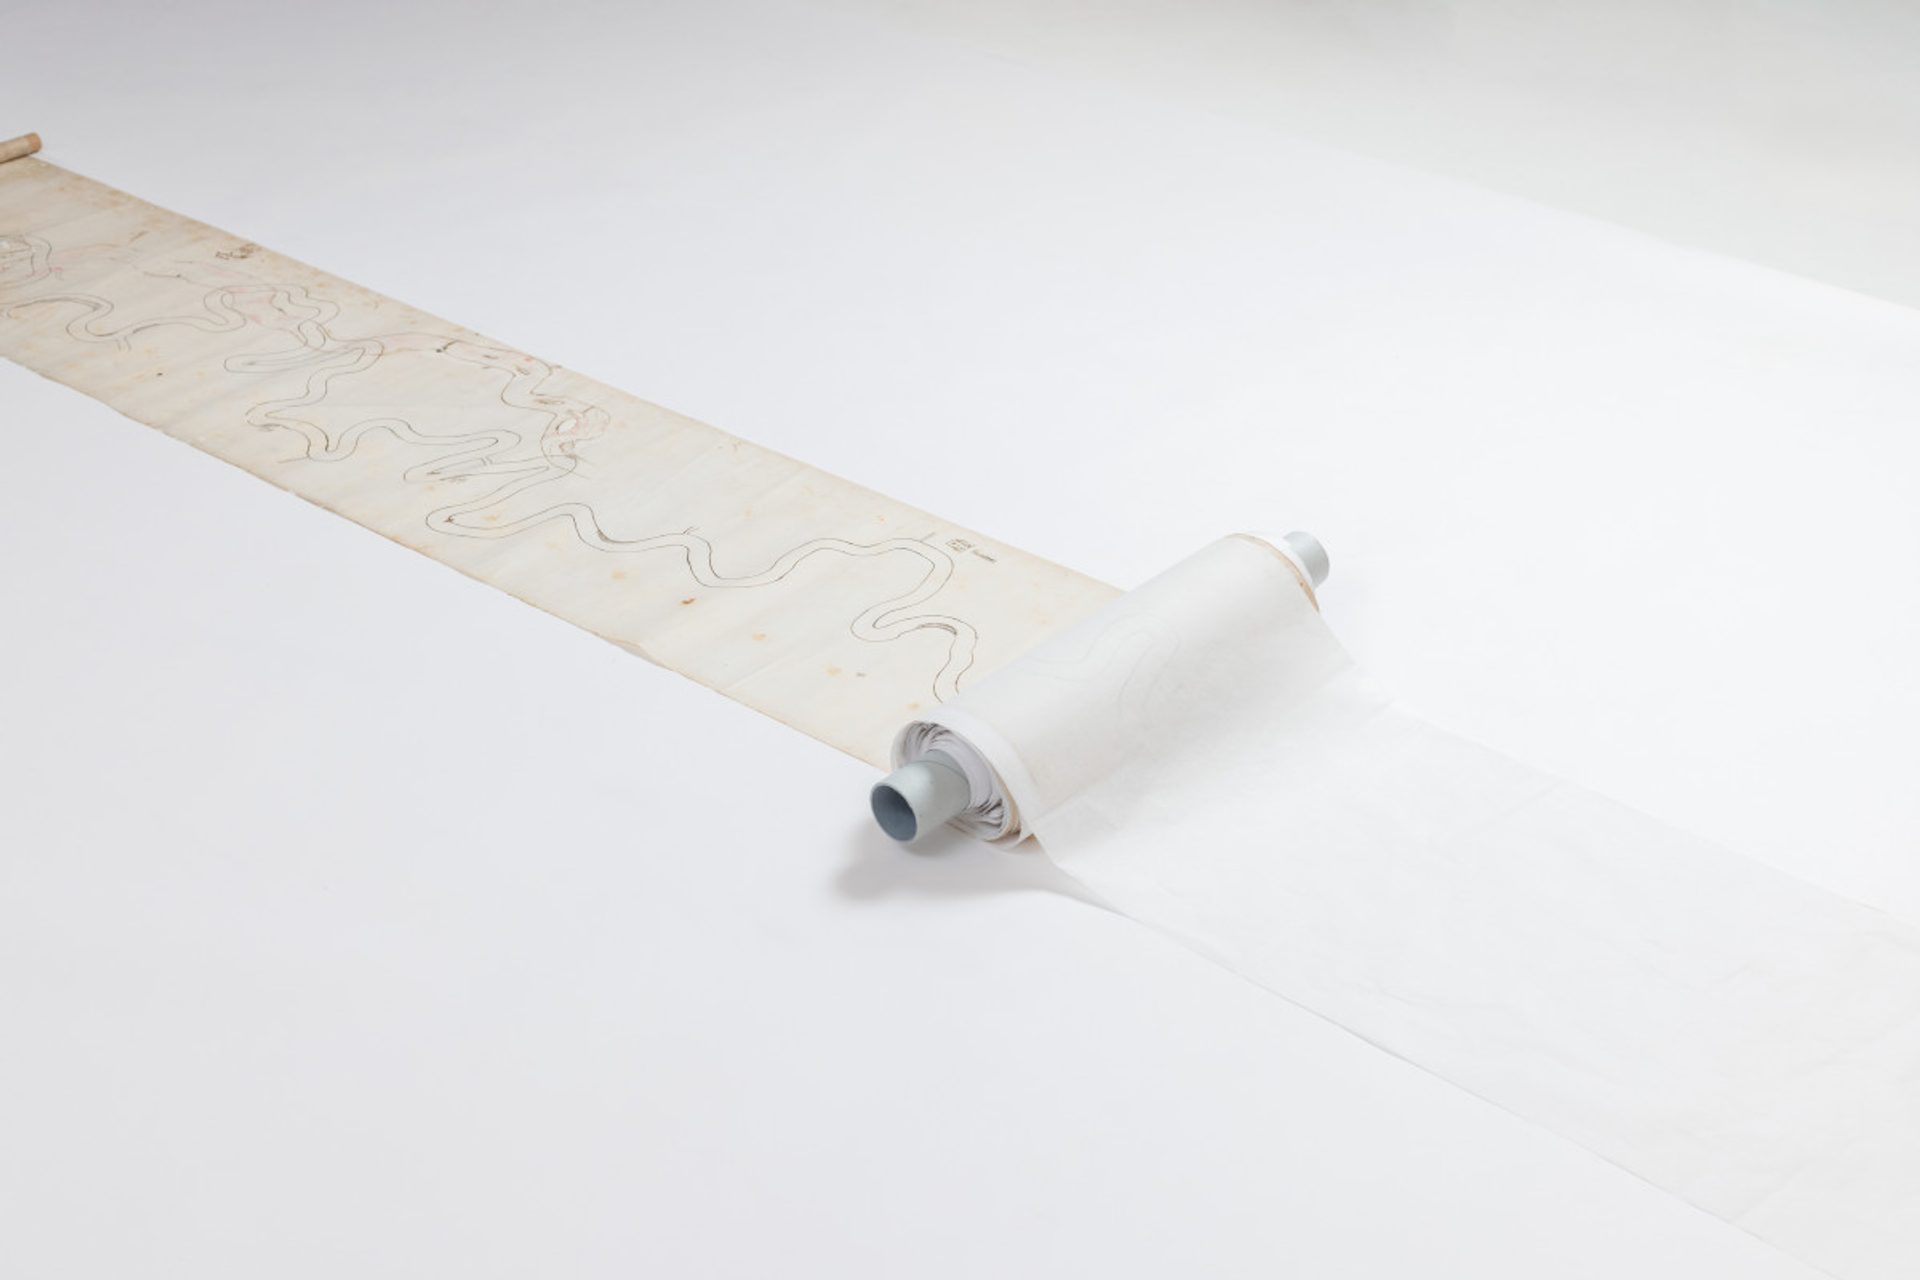
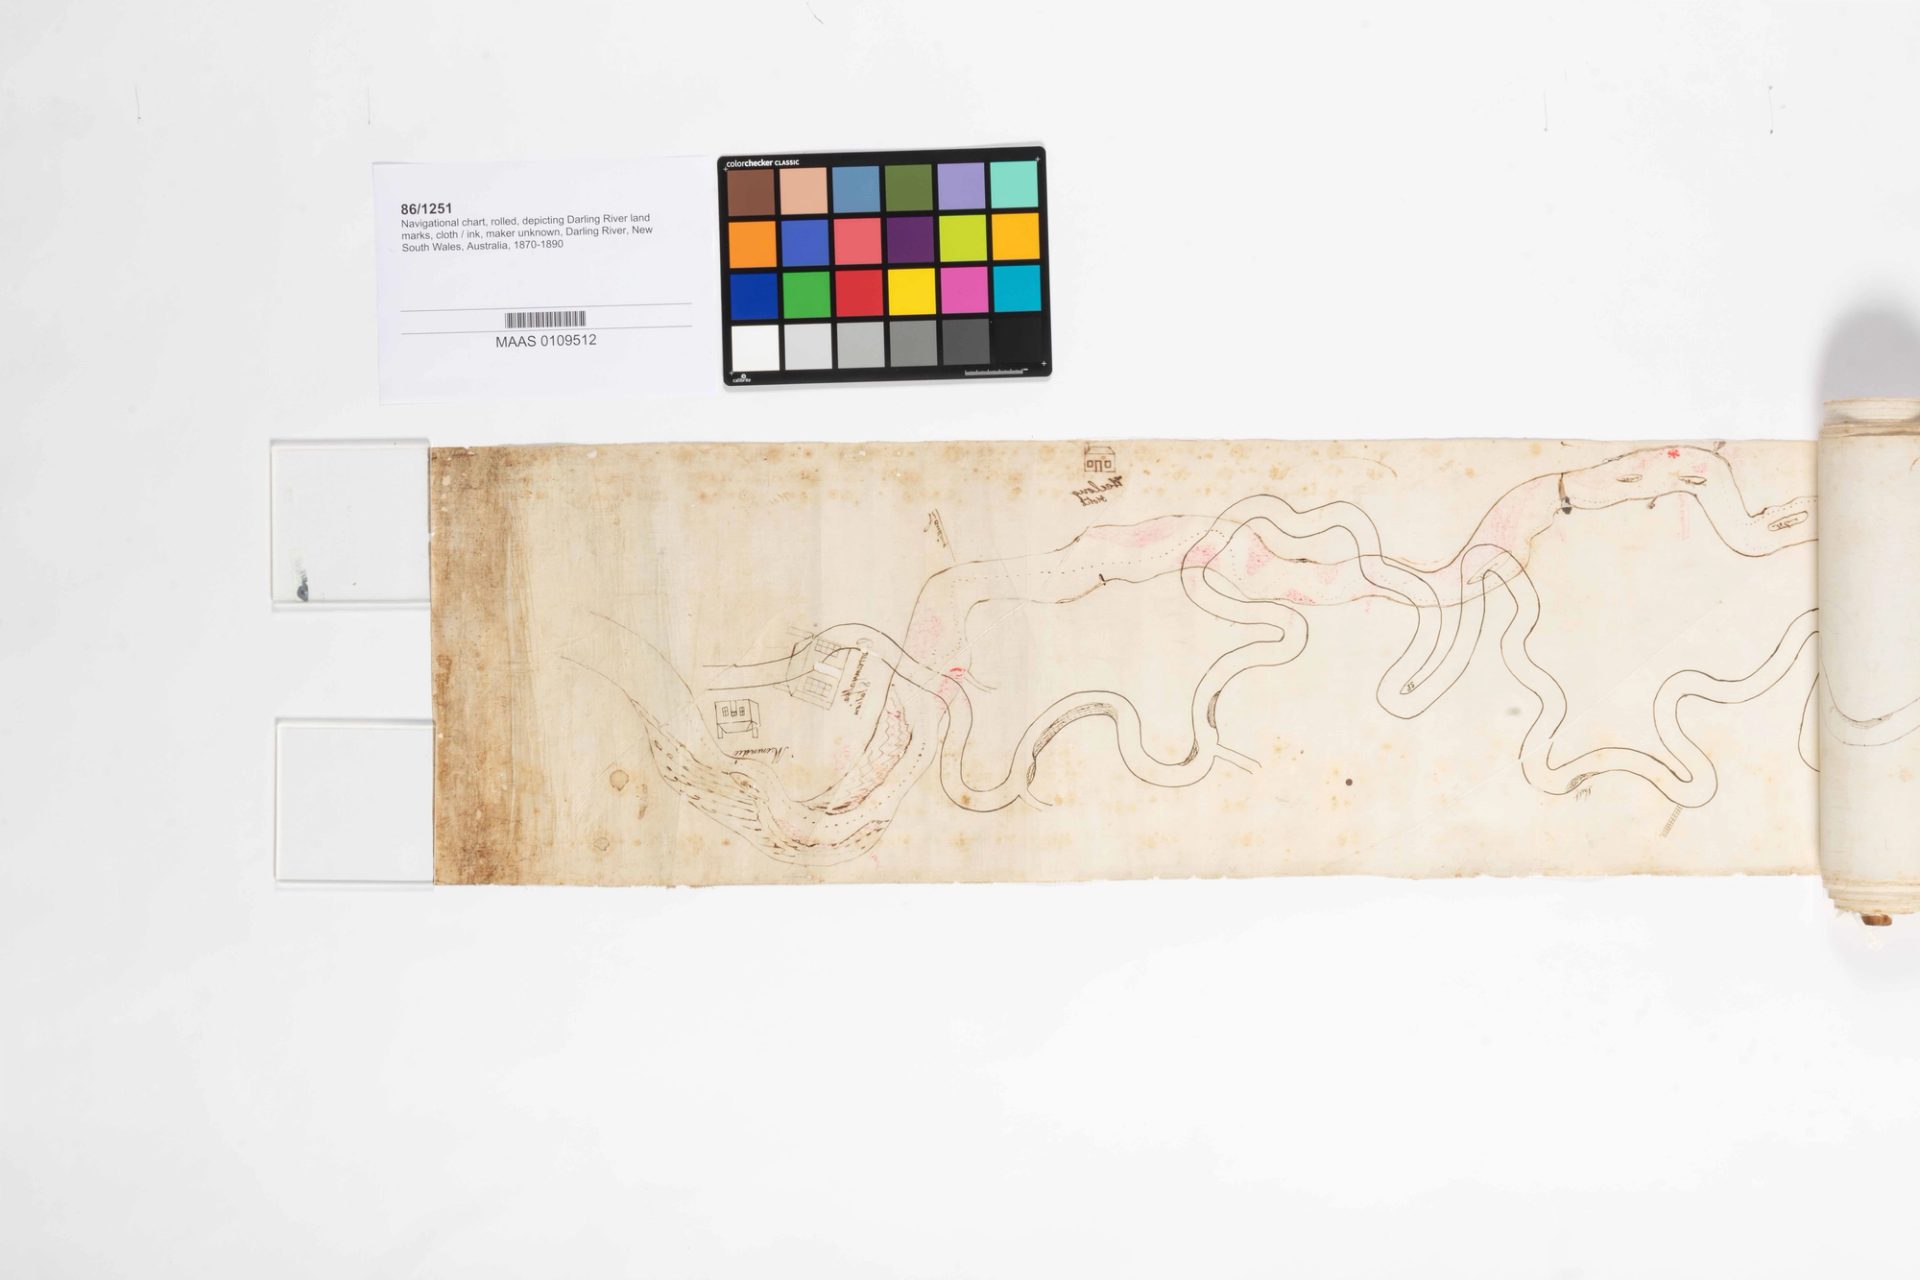
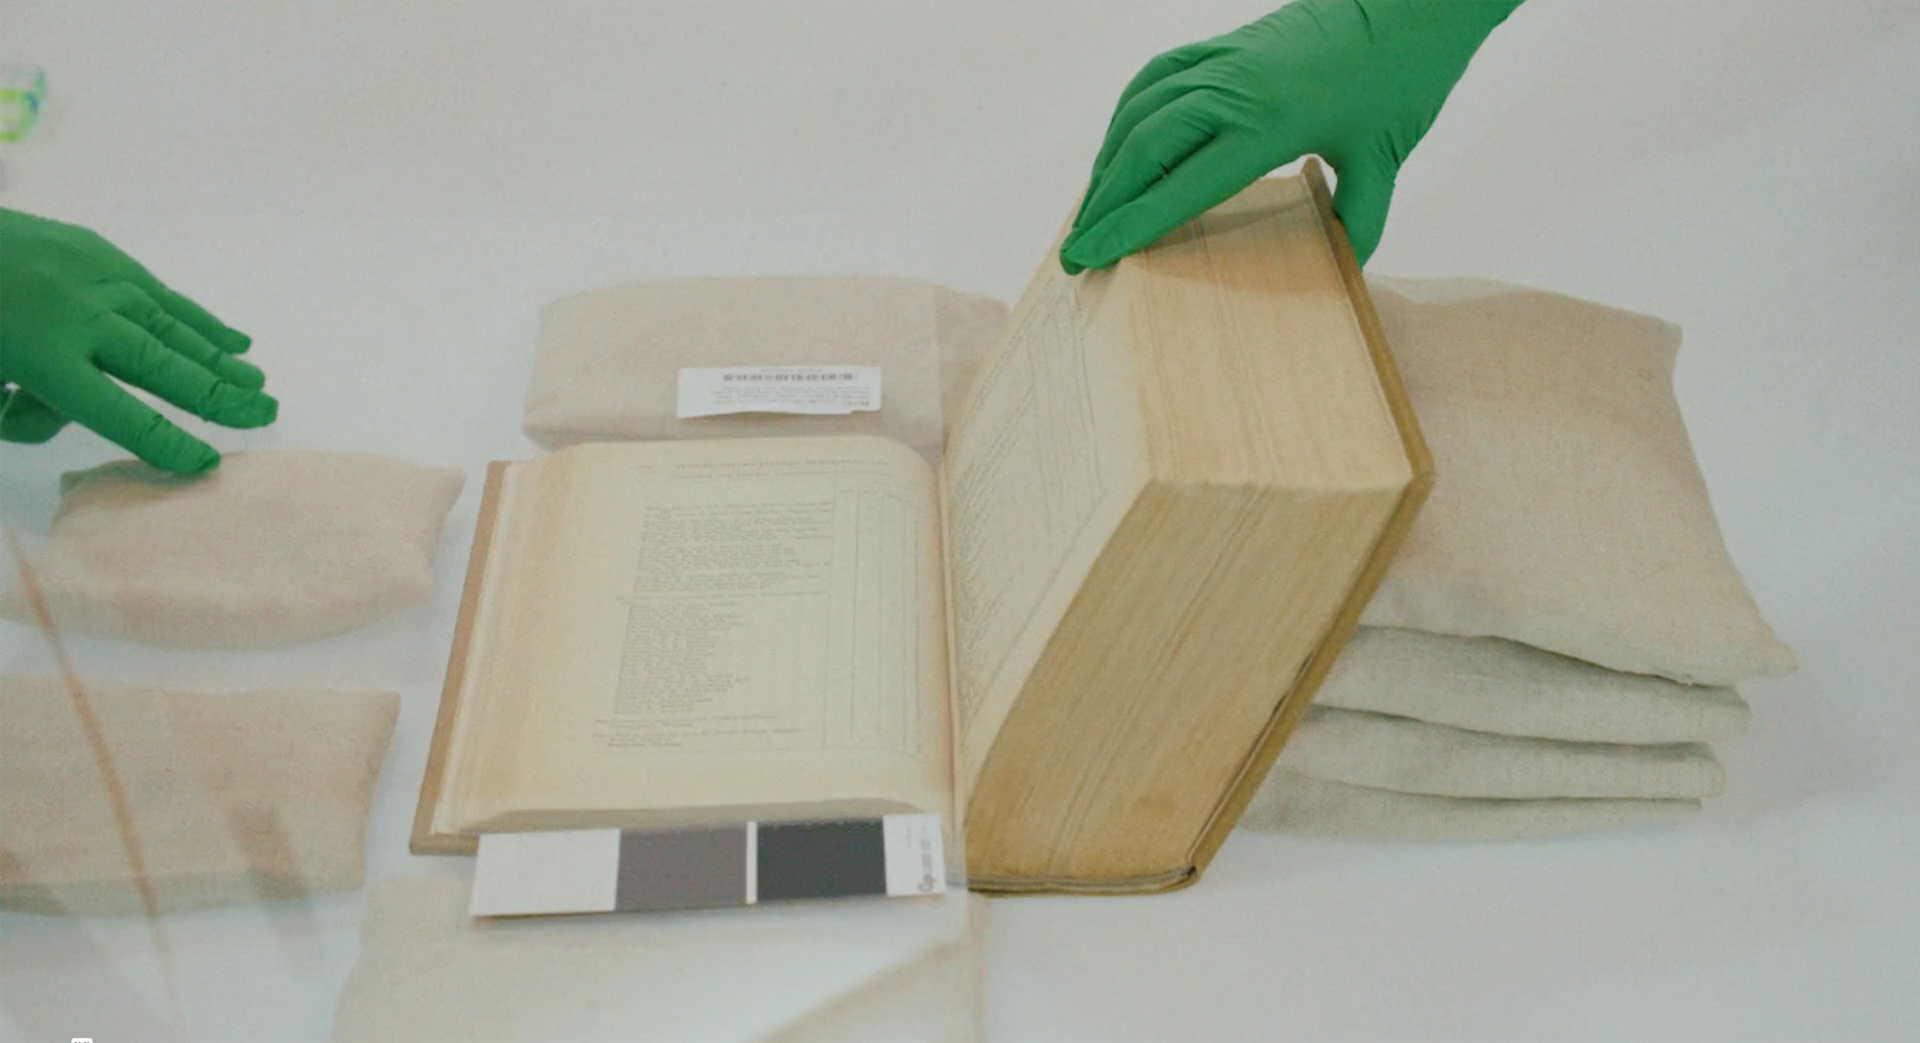
Since 2019, Powerhouse has been undertaking one of the largest digitisation projects internationally. Our ambition is to digitise the whole collection which is comprised of more than 500,000 objects. At 39 metres, Object No. 86/1251 ‘Paddle steamer captains’ navigational chart of the Darling River’ is one of the lengthiest objects in the Powerhouse Collection. It was repaired and digitised for the 2023 exhibition A Line A Web A World and is now accessible online.

Paddle steamer captains’ river navigational chart

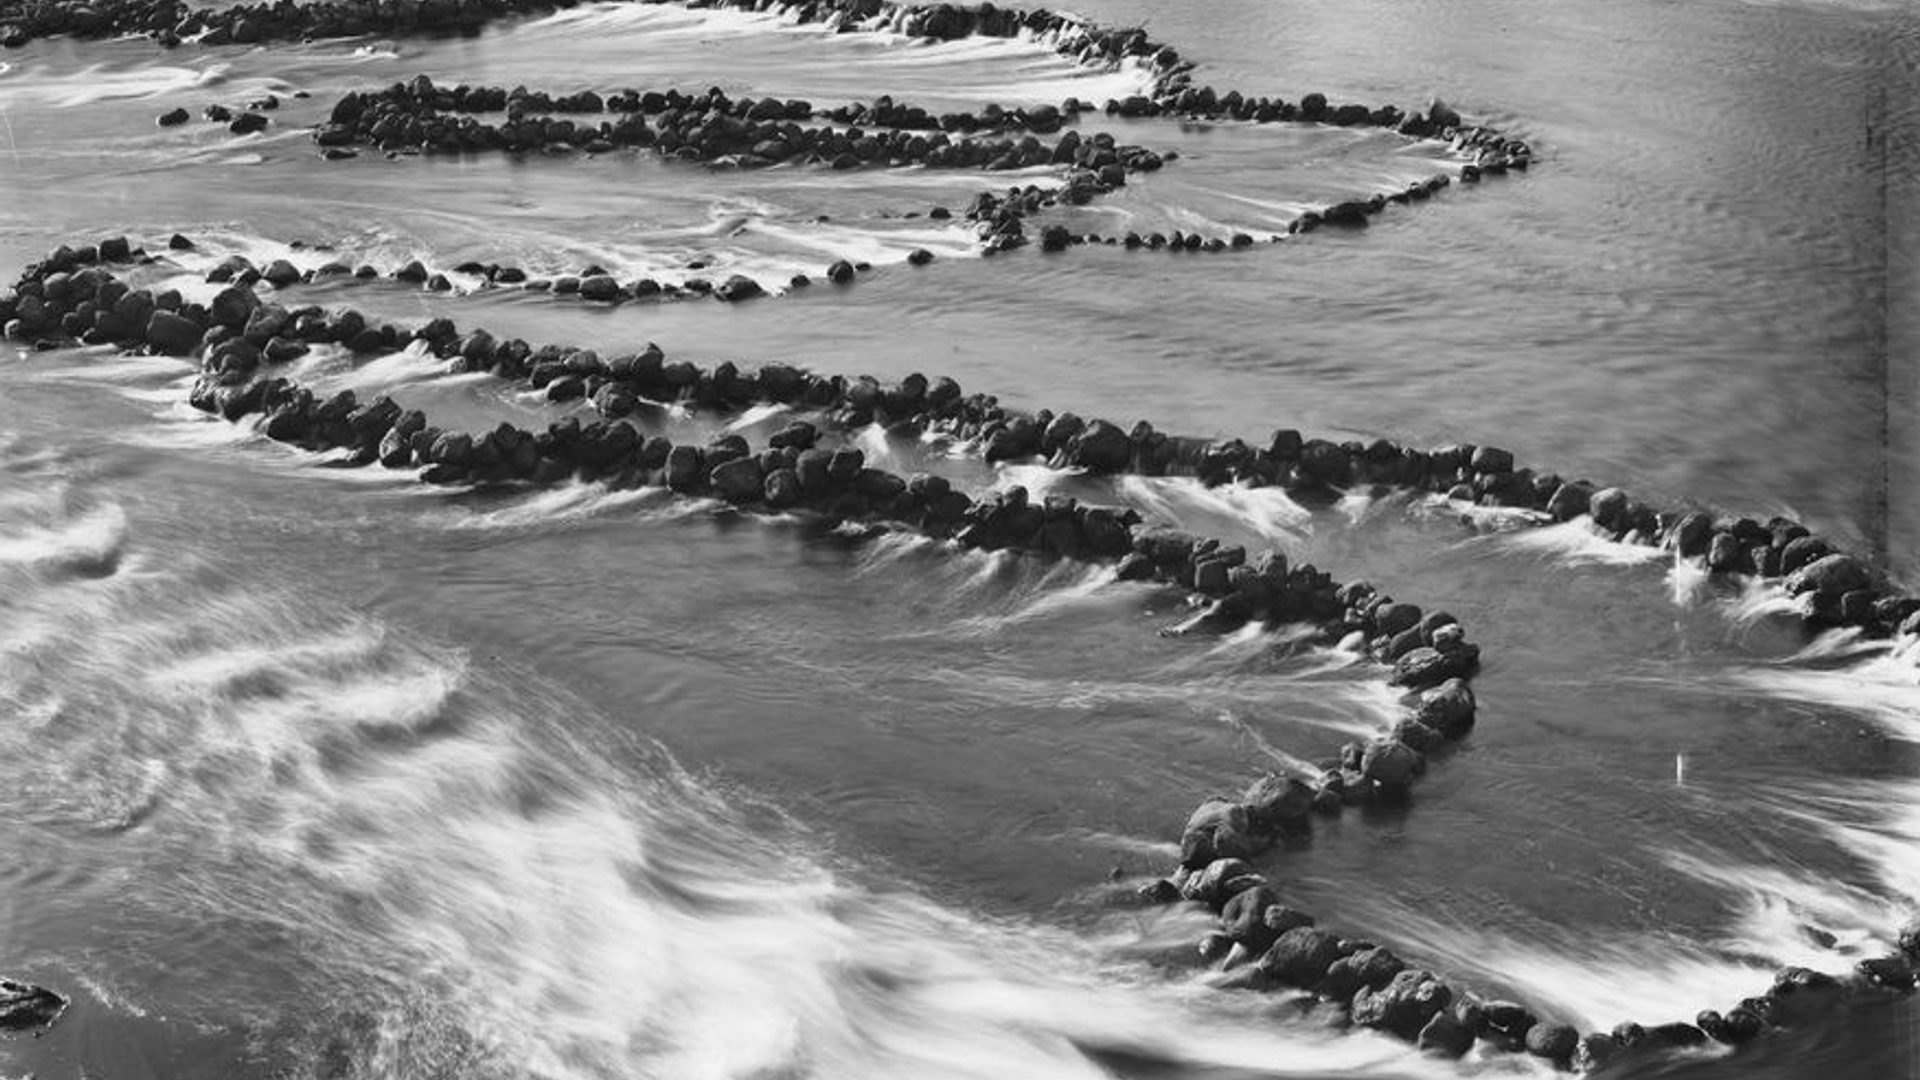
The Barka / Darling is one of the longest rivers in Australia, wandering from its source near Brewarrina and Bourke in north-west New South Wales across roughly 1500 kilometres of mostly flat plains to meet the Dhungala / Murray in the south at Wentworth.

From the mid-1800s it was a major freight route across NSW with around 100 paddle steamers and barges carrying passengers, farm supplies and up to 40,000 bales of wool each year. But by the turn of the century drought and expanded rail freight services had put most paddle boats out of business.

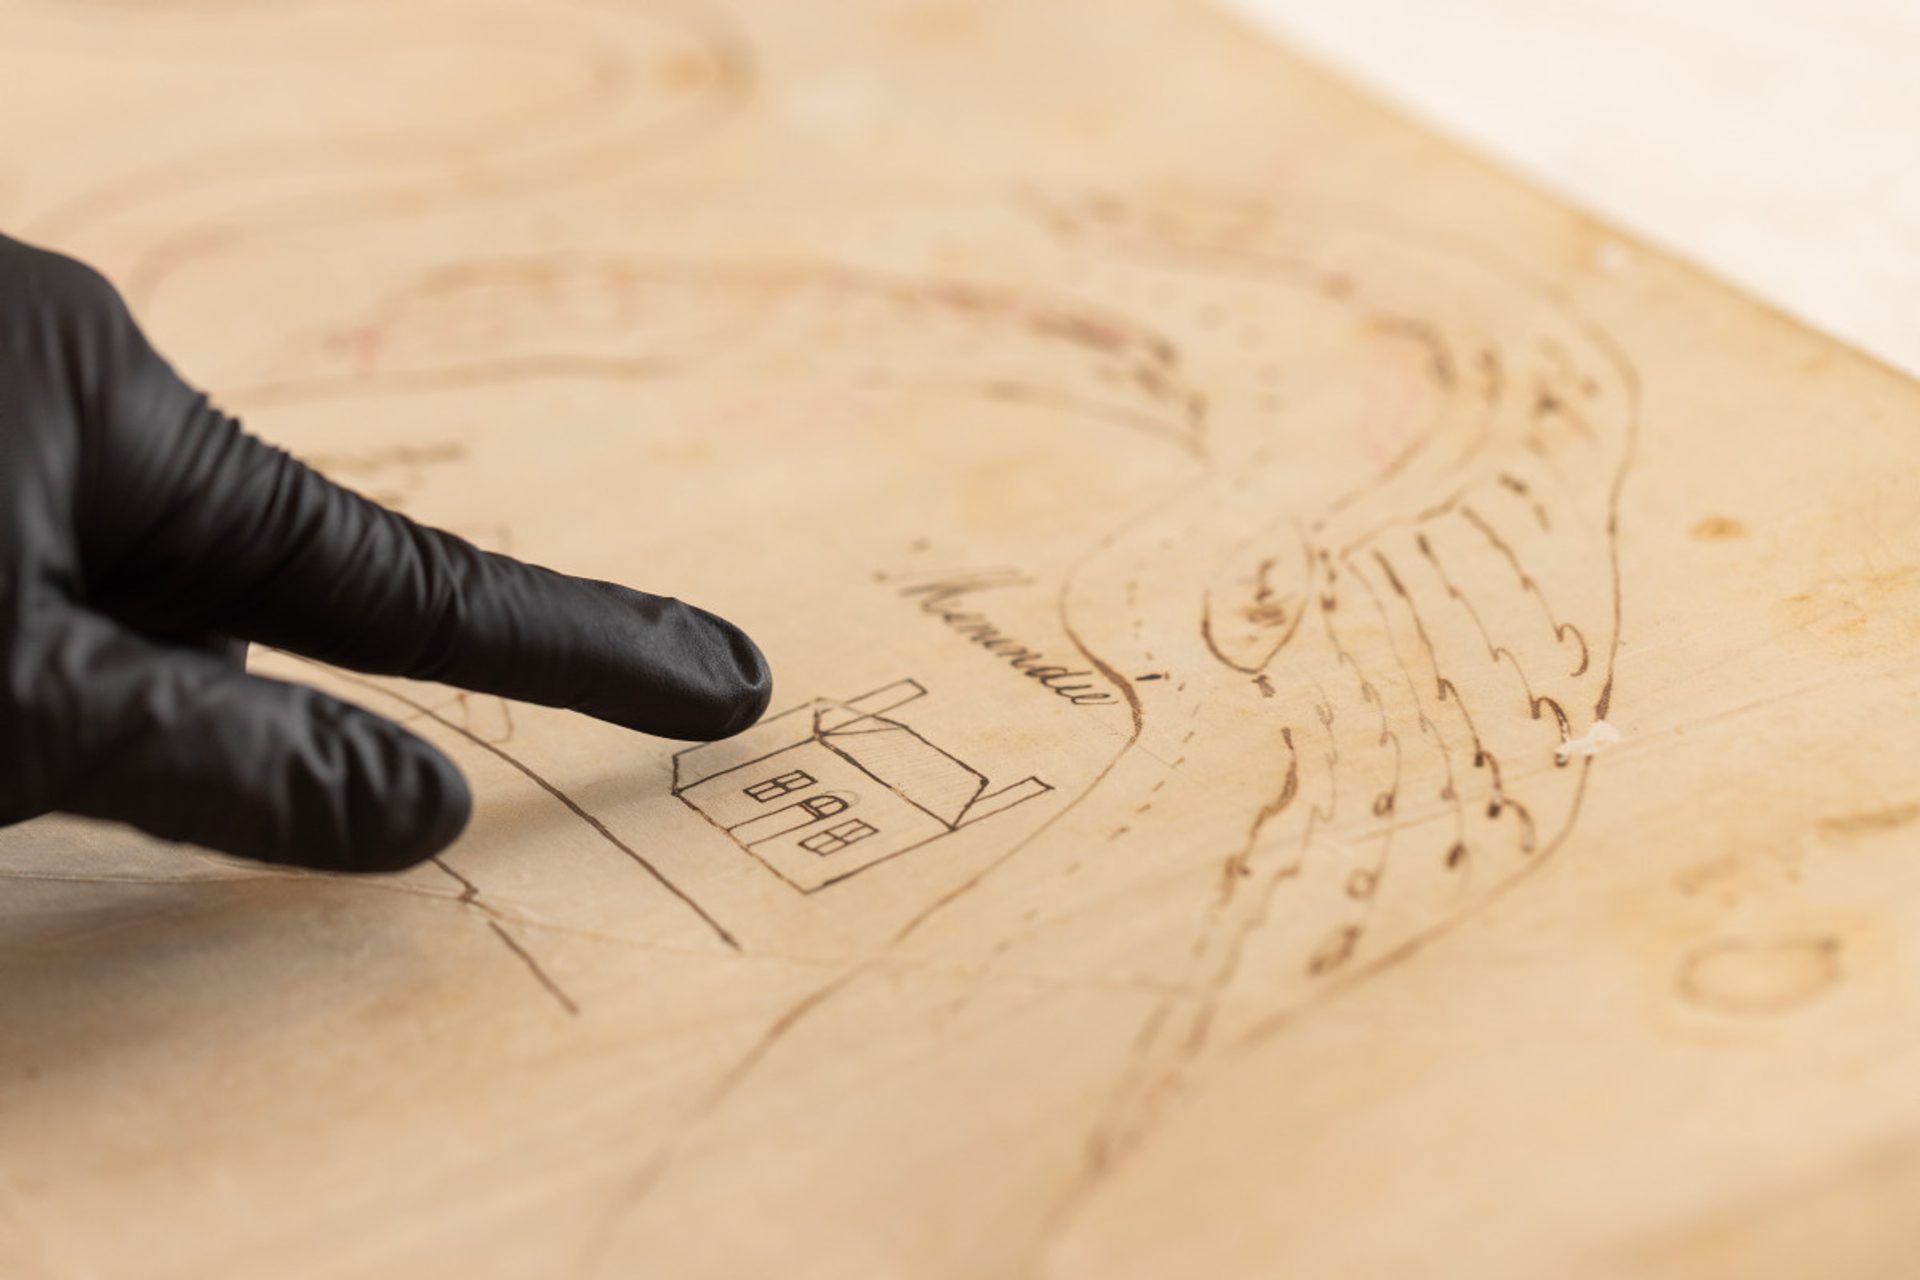
Powerhouse Collection Object No. 86/1251 is a navigation chart, or river map, that was drawn and used by Australian paddle steamer captains on the Barka / Darling River in New South Wales between 1870 and 1890. The river’s course, landmarks, woolsheds, hotels and homesteads from Menindee to Wentworth were hand drawn on the chart in iron gall ink with notes about rocks and dangerous river sections.

Scrolling left to right, the river map begins at Kinchega in northwest NSW and ends south near Race Course Hotel in Wentworth, where races are still held each year on Melbourne Cup Day.

Everything we do in conservation is reversible, so if in 50 years’ time there is a better system then whoever does it can make it better.
Beate Yule, conservator

Repairing linen sail cloth eroded by iron gall ink

The river map entered the Powerhouse Collection in 1986, but due to its size and fragility had never been on public display before. Comprehensive conservation work was completed ahead of its inclusion in the exhibition A Line A Web A World, Powerhouse Ultimo, 1 July 2023 ‒ 4 February 2024.

It was drawn by paddle steamer captains on linen sail cloth using iron gall ink, which is made by mixing iron salts with tannic acids extracted from fermented plant galls (abnormal bulbous growths on plants) and a binder such as acacia sap. The ink was a popular choice in the 1800s for these kinds of maps as it penetrates the cloth, making it very long lasting. Unfortunately, over time it also bites into the material.

‘The size of the map was a big challenge — it’s nearly 40 metres long — and there was significant tearing along the lines of the river,’ explains Powerhouse conservator Beate Yule. ‘Those tears were caused by the iron gall ink, which eats through any sort of substrate. In conservation we call this “strikethrough” or “lacing”. The problem with iron gall ink is that you can’t use a water-based adhesive to repair the material, because if you do introduce any moisture into it the iron the ions will migrate into the paper or linen and create this sort of haloing effect.’

Yule and her colleague Teresa Werstak repaired the river map using a cellulose-based adhesive called Klucel G mixed with ethanol to bind very thin Japanese tissue paper on the underside of the sail cloth. They wanted the repairs to be almost invisible.

First, they protected the map with a layer of clear archival polyester, overlaid it with the Japanese tissue paper and meticulously traced the shape of the river section with a pencil, a few metres at a time. Next, they cut the paper into thin river shapes — allowing just 5 mm either side of the line — brushed the back of the paper with the adhesive and smoothed the bond to the sail cloth with a bone folder (a tool often used in bookbinding, designed to prevent damage to delicate materials).

‘The advantage of using the Klucel and ethanol was that it dried really quickly, so we could move quickly along the line without having to weigh down the material,’ says Yule. ‘The first 20 metres might have been exposed to moisture more than the rest, so they needed the most work. We also put patches behind each little house or landmark. We were really happy the Klucel didn’t cause any tide lines or staining, and we’ve used it quite a lot since for other projects. It’s a very easily reversible adhesive — all you do is apply a bit of ethanol and it comes off again. Everything we do in conservation is reversible, so if in 50 years’ time there is a better system then whoever does it can make it better.’

Powerhouse workshop built a protective shelf for A Line A Web A World so the full length of the map could safely be displayed flat, allowing visitors to follow the line of the river when they walked from one end of a room to another.

It really is just being methodical, the process of it, and to avoid damage we only wanted to handle it once.
Linda Warlond, photographer
Gallery image
Gallery image
Gallery image
Stephanie McFarlane, Assistant Registrar, and Beate Yule, Conservator, preparing the river map for digitisation. Photos: Linda Warlond

Capturing a 39-metre almost-2D object, a metre at a time

The digitisation team also worked to capture images of the river map so this special object can remain accessible via the museum’s collection website after the conclusion of A Line A Web A World.

Photographers wanted to capture details of the river map in high resolution, but its length made that challenging.

Most objects in the Powerhouse Collection will comfortably fit within a single photographic frame when shot from a suitable distance. Even a large vehicle, such as a monorail car, can be positioned in one of the museum’s state-of-the-art photography studios and captured from any angle.

A two-dimensional object such as a poster is typically laid flat on a studio table or floor, perhaps covered in glass to flatten it, and shot from above.

But it wasn’t feasible to unroll the entire river map and photograph it from way up high — the resulting images wouldn’t be of high enough resolution — and though it’s basically a long scroll of cloth, the surface of the river map isn’t exactly two dimensional. The edge is never quite straight either.

‘We’re not just documenting what’s on the map, we want to document the object itself, with all its undulations and imperfections,’ says Nick Kleindienst, manager of Collection Operations and Digitisation Projects. ‘So, we’re thinking about angle of incidence when lighting an object like this. The map has a slight sheen, which could reduce the contrast in some parts of the image based on the position of the lights.’

When the Powerhouse digitisation team began capturing the entire map as a digital object, an early decision was to unroll and shoot one metre at a time on the floor of a studio. The images of each section would then be ‘stitched’ in sequence during digital postproduction to create a single long scroll. The team also chose not to flatten it beneath glass, as that risked damaging the map.

Working with a team of conservators, photographer Linda Warlond gently unrolled the object to reveal just over a metre for each shot and positioned its bottom edge as straight as possible against reference markers on a backdrop.

Gallery image
Gallery image
Gallery image
Chris Jones, Registrar, Collections Project, and Stephanie McFarlane, Assistant Registrar, examining the river map. Photos: Linda Warlond

The digitisation team allowed 100 mm extra map length either side of the metre to give the postproduction team some overlap during the image stitching and included a Macbeth Chart for colour calibration at the edge of each frame. Warlond also set up copy lighting from each side, which provides flat, even illumination over the whole object:

‘Each frame, each section, we’d light meter all four corners as well as the centre to make sure there was even distribution of light,’ says Warlond. ‘You don't want one stop of light difference between any point because you'll end up with a vignette effect. And when you’re stitching those images together you’d get those vignettes joining up.’

With the camera locked in place on an overhead rig, Warlond systematically captured all 39 metres on a digital SLR camera using a 50 mm lens in a little over an hour.

‘I shot it at f/16 and ISO 100, the native ISO speed of the camera, to make sure everything was in focus and we captured as much detail as possible,’ she notes. ‘Every image was named in the order it was shot, otherwise you would really struggle to put them all together in post-production, with so many long snaking curves in the river. It really is just being methodical, the process of it, and to avoid damage we only wanted to handle it once.’

When you have images that are gigabytes and gigabytes in size you run into all sorts of weird technical limitations in file types and digital asset management systems.
Luis Power, digital asset implementation manager

‘It broke the jpeg image limit’

The post-production quality assurance team took the RAW files from the camera and crosschecked their Macbeth Chart colour references to create a custom capture profile of the images taken by that particular camera, lens and lighting set up used on the day.

The capture profile helps the digitisation team colour grade the images so they’re as close to scientifically accurate as possible. The photographer is also consulted to make sure each image shows as close to possible what their eyes saw on the day.

‘There’s a lot of processing of the RAW file including adjusting for things like the inherent distortion of the lens or imperfections in the lens that cause chromatic aberrations which appear as little red and green bands on the edges of the frame,’ explains Luis Power, Digital Asset Implementation Manager. ‘We then generated a preservation master file (in the TIFF format) for each image and they’re each in the 50 megapixels / 200 MB range. We found we had to stitch them together in sections, because if you bring 39 of those big files into Photoshop to combine them, suddenly every process is really slow.’

‘The other thing we found was when we went to export the stitched image for an access copy in jpeg, which is a format for websites, we ran into a limitation where the resolution of the image was too high for the file type — it broke the jpeg image limit. When you have images that are gigabytes and gigabytes in size you run into all sorts of weird technical limitations in file types and digital asset management systems.’

The final stitched image of the map was downsized because the jpeg format allows a maximum size of 65,535 x 65,535 pixels but if all 39 frames were stitched together at full resolution (5928 x 5928 pixels each), their combined length would be more than 137,500 pixels — well over double what jpeg can handle.

The digital asset team is very focused on making sure each image represents the object as accurately as possible to what visitors would see in the real world. In the case of the river map, this included saving the original individual frames as preservation master files in the digital asset management system alongside web-ready versions at lower resolutions and a readily accessible version of the stitched map.

‘We use scripts in our digital asset management system to review what was shot,’ says Power. ‘We check the metadata and the physical structure of the file at a zeros and ones level to confirm it’s readable, so that in 100 years’ time when someone opens up a file, they can. And we also generate checksums for each file in three formats (digital negative, TIFF, and jpeg), which are essential for digital preservation. They are used to check if changes are made to a file and allow us to perform fixity (the state of being fixed, unchanging and stable) processes. In one, five, or 10-years’ time we can go back and look at that file and regenerate a checksum to make sure it matches. And if it doesn't, we know something has changed along the way.’

First Nations languages are part of oral traditions that have existed for millennia and do not directly translate into the Roman alphabet, as used in English. Therefore, First Nations languages’ sounds have been interpreted in many different spellings. This means that the same words, including language groups and place names may be spelled in two or three different ways. For this publication, we have privileged the spellings of First Nations place names as advised by the First Nations Directorate unless advised otherwise by Traditional Owners.